

[free_download_btn]
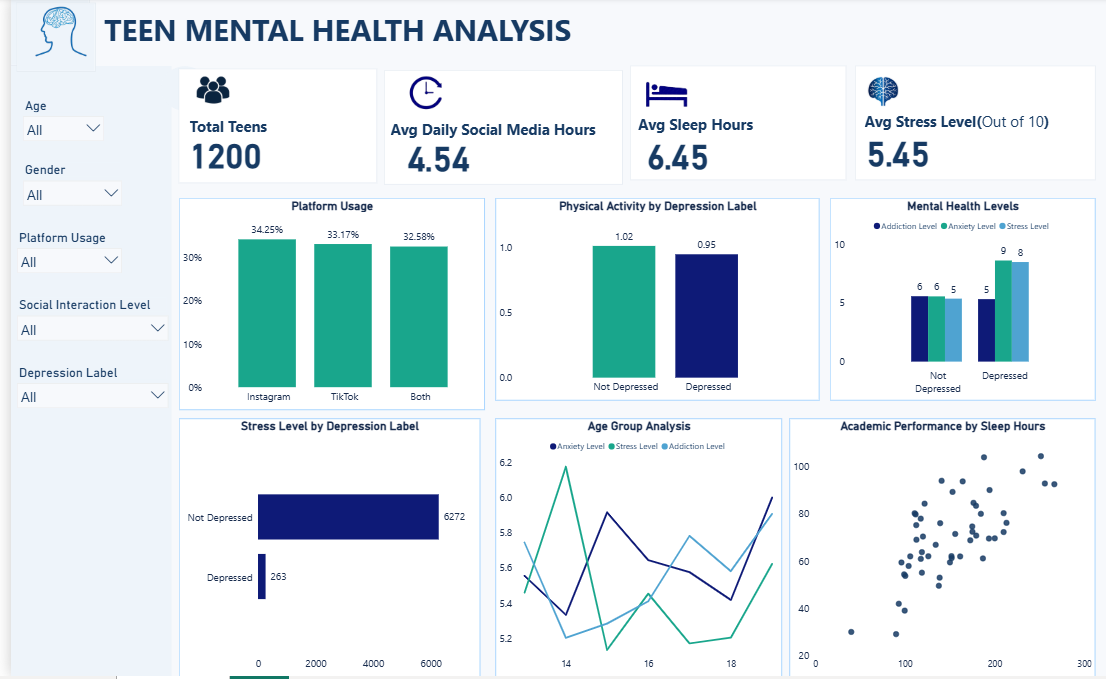
Mental health data is always a little more delicate to work with than a typical business dataset, because the numbers represent real teenagers navigating something serious. For this project I worked with a dataset covering 1,200 teens, tracking daily social media use, sleep hours, stress and anxiety levels, physical activity, academic performance, and depression status. I built a Power BI dashboard around it to see what actually correlates with wellbeing in this age group, rather than relying on assumptions about screens and mental health that get repeated without much evidence behind them.
The dataset came from Kaggle, and the dashboard includes filters for age, gender, platform usage, social interaction level, and depression label, so the data can be explored from a few different angles.
Key Performance Overview
Across the 1,200 teens in the dataset, average daily social media use comes out to 4.54 hours, average sleep sits at 6.45 hours, and the average stress level, on a scale of 1 to 10, is 5.45. Those three numbers together already suggest a group that's getting less sleep than commonly recommended for teens while carrying a moderate to elevated stress load.
Platform Usage
Instagram, TikTok, and teens who use both platforms are almost evenly split, at 34.25 percent, 33.17 percent, and 32.58 percent respectively. There's no single platform dominating this group's attention, which suggests that any conversation about social media's effect on teen mental health probably needs to look at usage patterns as a whole rather than pointing at one app in particular.
Physical Activity by Depression Label
Teens labeled as not depressed report slightly higher physical activity at 1.02 compared to 0.95 for teens labeled as depressed. The gap is small, but it's consistent with a pattern seen in a lot of mental health research, where physical activity and depression tend to move in opposite directions, even if this dataset alone can't say which one is driving the other.
Mental Health Levels
Looking at addiction, anxiety, and stress levels side by side for depressed versus not depressed teens, every single measure comes in higher for the depressed group. Addiction level moves from 6 to 9, anxiety from 6 to 8, and stress stays close but still ticks up slightly. None of these differences are enormous on their own, but the fact that all three point the same direction is worth paying attention to.
Stress Level by Depression Label
This chart shows a much bigger gap, with teens labeled not depressed accounting for 6,272 combined stress points compared to 263 for depressed teens. Given how small that second number looks next to the group averages elsewhere in the dashboard, this is most likely reflecting a much smaller depressed subgroup within the sample rather than lower stress overall, which is a good reminder to always check what a chart is actually summing before drawing conclusions from it.
Age Group Analysis
Anxiety, stress, and addiction levels all move around quite a bit across ages 14 through 18, without a clean upward or downward trend. Stress level in particular spikes hard around age 14 before dropping and climbing again later. Nothing here points to mental health simply getting worse with age in a straight line, it looks more like a bumpier picture shaped by whatever else is happening at each specific age.
Academic Performance by Sleep Hours
The scatter plot comparing academic performance to sleep hours shows a loose but visible upward trend. Teens getting more sleep tend to cluster toward higher academic performance scores, though there's plenty of spread, meaning sleep isn't the only factor at play, just one that seems to matter.
Methodology: Tools and Approach
This dashboard was built in Power BI using visuals chosen to compare groups and track relationships between variables.
Key techniques used include:
- KPI cards for total teens, average social media hours, average sleep, and average stress level
- Bar charts for platform usage and physical activity by depression label
- A grouped bar chart for mental health levels by depression label
- A horizontal bar chart for stress level by depression label
- A multi-line chart tracking anxiety, stress, and addiction across age groups
- A scatter plot comparing academic performance to sleep hours
- Interactive slicers for age, gender, platform usage, social interaction level, and depression label
Key Takeaways
- No single platform dominates usage, so screen time patterns matter more than platform choice alone
- Depressed teens show higher levels across addiction, anxiety, and stress compared to non-depressed teens
- Mental health metrics don't trend cleanly with age, they fluctuate depending on the specific age
- More sleep loosely tracks with better academic performance, though the relationship isn't tight
- Physical activity is slightly lower among depressed teens, consistent with broader research trends
Conclusion
Working through this dataset was a reminder that teen mental health rarely comes down to one cause. Sleep, activity, stress, and screen habits all seem to move together in ways that are easy to miss if you're only looking at one metric at a time. If you want to explore the dataset yourself, you can find it on Kaggle here: https://www.kaggle.com/datasets/sunil123kumar/social-media-impact-on-mental-health.
- Version
- Download 21
- File Size 185.39 KB
- File Count 3
- Create Date September 22, 2026
- Last Updated September 22, 2026
