
[free_download_btn]
AI has become part of everyday student life, but its impact is not limited to how students complete assignments or find information. It can also shape study habits, task frequency, academic performance, career confidence, and even how students feel about using AI tools.
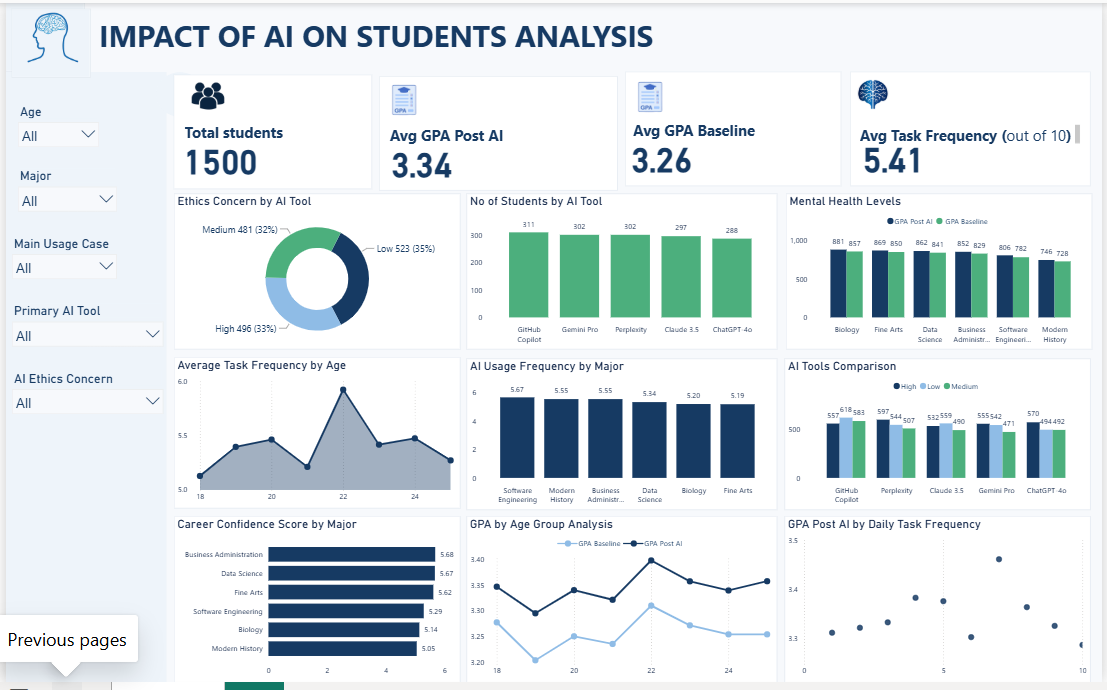
I built this Power BI dashboard to explore those relationships using a dataset focused on AI and student life in 2026. The dashboard covers 1,500 students and looks at GPA before and after AI usage, AI tools, usage frequency, academic majors, age groups, mental health levels, career confidence, and ethical concerns. The dataset is available on Kaggle as AI and Student Life 2026: The New Normal. Kaggle
2. Key Performance Overview
The headline figures give an interesting starting point. The average GPA after AI usage is 3.34, compared with a baseline GPA of 3.26, representing a 0.08-point difference. The average task frequency is 5.41 out of 10, giving some context around how frequently students engage with tasks. Across the dataset, the dashboard represents 1,500 students, providing a broad view of how AI intersects with different areas of student life.
3. A Breakdown of the Major Visuals
Ethics Concern by AI Tool
Students were fairly evenly distributed across the three ethics concern levels. 523 students (35%) reported low concern, compared with 481 (32%) at medium concern and 496 (33%) at high concern. That balance is worth noting because concern about AI is not concentrated in just one category.
Number of Students by AI Tool
GitHub Copilot has the highest representation with 311 students, followed by Gemini Pro and Perplexity with 302 each. Claude 3.5 accounts for 297, while ChatGPT-4o has 288. The differences are relatively small, suggesting that no single tool completely dominates the dataset.
Mental Health Levels
The comparison across majors shows higher values for the earlier categories, with Biology at 881 versus 850, Fine Arts at 869 versus 850, and Data Science at 862 versus 841 across the two displayed measures. Software Engineering and Modern History record the lower values, at 806 versus 782 and 746 versus 728 respectively. The visual makes these differences much easier to spot across majors.
Average Task Frequency by Age
Task frequency varies noticeably across the age groups. The chart rises from about 5.12 at age 18 to roughly 5.42 at 19, reaches around 5.49 at 20, and then peaks at approximately 5.91 at age 22. It falls again afterward, showing that task frequency does not move steadily upward with age.
AI Usage Frequency by Major
Software Engineering has the highest average usage frequency at 5.67, followed by Modern History and Business Administration at 5.55 each. Data Science records 5.34, while Biology and Fine Arts are at 5.20 and 5.19. The spread is relatively narrow, but Software Engineering still sits at the top of the comparison.
AI Tools Comparison
The tool comparison adds another layer by breaking usage into high, low, and medium levels. GitHub Copilot has values of 557, 618, and 583, while ChatGPT-4o records 570, 494, and 492 across the three categories. The pattern varies considerably by tool, rather than showing one consistent usage profile.
Career Confidence by Major
Business Administration records the highest career confidence score at 5.68, closely followed by Data Science at 5.67 and Fine Arts at 5.62. Modern History sits at 5.05, with Biology at 5.14 and Software Engineering at 5.29. The differences show that career confidence varies across academic disciplines.
GPA by Age Group
The GPA comparison shows the post-AI line consistently above the baseline line across the displayed ages. At age 22, for example, post-AI GPA reaches 3.40, compared with a baseline of approximately 3.31. The baseline also reaches its highest visible point around age 22, showing that age and GPA patterns are worth examining together rather than in isolation.
GPA Post AI by Daily Task Frequency
The scatter plot shows post-AI GPA values ranging from roughly 3.30 to 3.46 across daily task frequencies. The highest visible point is around 3.46, but the points do not form a simple upward line. Higher task frequency therefore does not automatically correspond to progressively higher GPA in this view.
4. Methodology: Tools and Approach
- KPI cards for student count, GPA and task frequency
- Donut charts for ethics concerns and work-related distributions
- Column charts for AI tools and major comparisons
- Bar charts for career confidence
- Line and area charts for age-based task frequency
- Line charts for baseline versus post-AI GPA
- Scatter plot for GPA and daily task frequency
- Slicers for Age, Major, Main Usage Case, Primary AI Tool and AI Ethics Concern
- Interactive filtering through Power BI
5. Key Takeaways
- The average GPA increased from 3.26 baseline to 3.34 post-AI in the dashboard.
- GitHub Copilot has the largest student count at 311, although the differences between tools are relatively small.
- Software Engineering has the highest AI usage frequency at 5.67.
- Business Administration records the highest career confidence score at 5.68.
- Ethics concerns are relatively balanced, with 35% low, 32% medium, and 33% high.
- The relationship between daily task frequency and post-AI GPA is not a simple upward trend.
6. Conclusion
Building this dashboard reinforced how much context matters when telling a story with student data. A single KPI such as the increase from 3.26 to 3.34 can catch attention, but the surrounding visuals make it possible to ask better questions about age, major, AI tool, task frequency, and student experience.
The project also reinforced the value of interactive dashboard design. Instead of presenting one fixed conclusion, the slicers allow the user to explore how the numbers change across different student groups and usage patterns.
- Version
- Download 18
- File Size 252.91 KB
- File Count 3
- Create Date September 22, 2026
- Last Updated September 22, 2026
