

[free_download_btn]
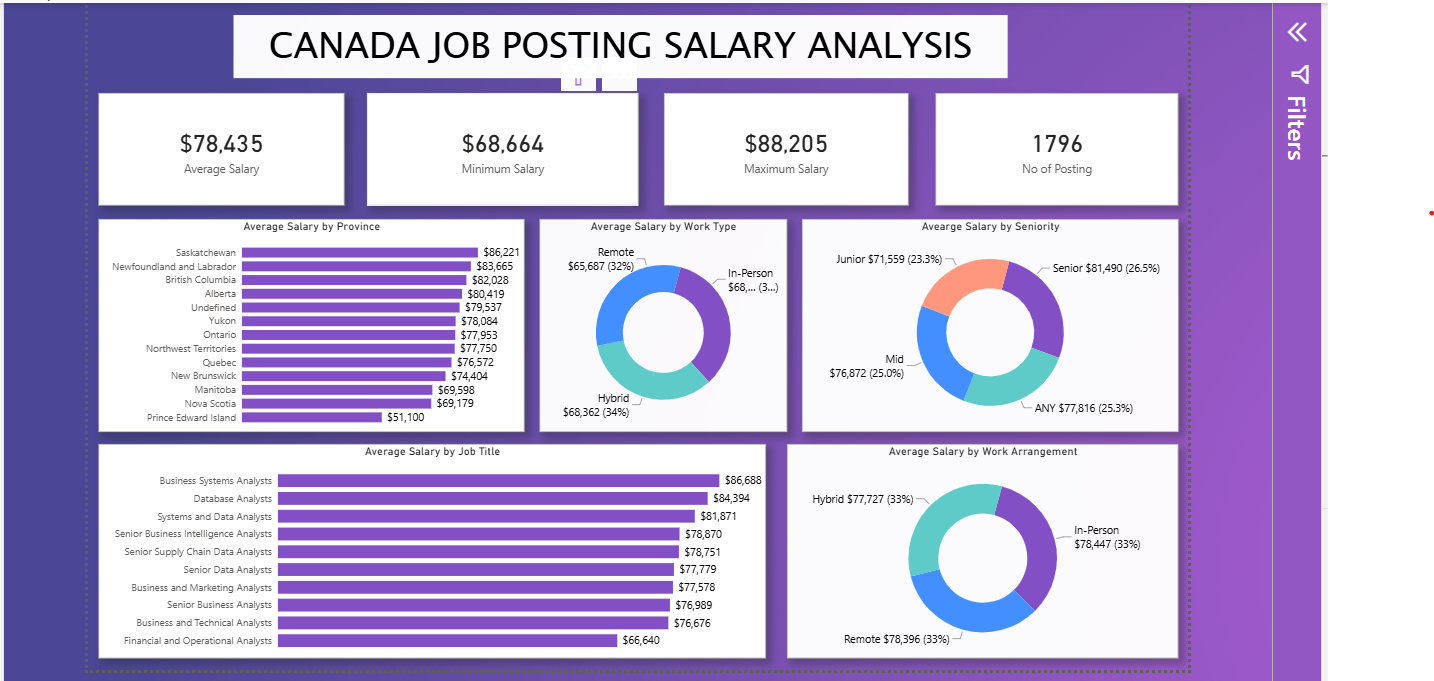
I built this Power BI dashboard to explore salary patterns across data analyst job postings in Canada. The dashboard looks at 1,796 job postings, comparing salaries across provinces, job titles, seniority levels, work types, and work arrangements.
The project uses the Data Analyst Job Roles in Canada dataset published on Kaggle by Aman Bhattarai. Kaggle dataset: Data Analyst Job Roles in Canada I used Power BI to turn the job posting data into an interactive view of how compensation varies across different parts of the Canadian data analyst market.
Key Performance Overview
The dashboard reports an average salary of $78,435, with a minimum salary of $68,664 and a maximum salary of $88,205. Across the 1,796 postings, these figures provide a useful overall salary range before looking at the differences between provinces, roles, seniority levels, and working arrangements.
Average Salary by Province
The provincial comparison shows a noticeable spread in average salaries. Saskatchewan leads at $86,221, followed by Newfoundland and Labrador at $83,665 and British Columbia at $82,028. Alberta follows at $80,419.
At the other end, Prince Edward Island records the lowest average shown at $51,100, while Nova Scotia averages $69,179 and Manitoba $69,598. The difference between Saskatchewan and Prince Edward Island is substantial, showing that location is an important dimension when comparing salaries in these postings.
Average Salary by Work Type
The work type donut chart compares Remote, Hybrid, and In-Person positions. Remote roles show an average salary of $65,687, representing 32% of the displayed breakdown, while Hybrid roles show $68,362, representing 34%.
The in-person category makes up the remaining 34% of the breakdown. The distribution is therefore fairly balanced between the three work types, although the salary figures shown for remote and hybrid positions are lower than the overall dashboard average.
Average Salary by Seniority
The seniority breakdown is also relatively balanced. Senior positions average $81,490, representing 26.5%, while Junior positions average $71,559, representing 23.3%.
The dashboard also shows Mid-level roles at $76,872, accounting for 25.0%, and roles categorized as ANY at $77,816, representing 25.3%. The figures show a clear difference between the Junior and Senior categories, with the senior average being $9,931 higher.
Average Salary by Job Title
The job title chart provides some of the clearest differences in the dashboard. Business Systems Analysts have the highest average salary shown at $86,688, followed by Database Analysts at $84,394 and Systems and Data Analysts at $81,871.
Several other roles fall within the upper $70,000 range, including Senior Business Intelligence Analysts at $78,870 and Senior Supply Chain Data Analysts at $78,751. At the bottom of the displayed list, Financial and Operational Analysts average $66,640.
Average Salary by Work Arrangement
The work arrangement chart shows very similar salary levels across the three categories. In-Person roles average $78,447, while Remote roles average $78,396 and Hybrid roles average $77,727.
What stands out here is how close these figures are. The difference between the highest and lowest average is only $720, suggesting that the work arrangement categories themselves have very similar average salaries in this dashboard.
Methodology: Tools and Approach
- KPI cards for average, minimum, and maximum salary and posting count
- Horizontal bar charts for province and job title comparisons
- Donut charts for work type, seniority, and work arrangement
- Power BI slicers and filters for interactive exploration
- Aggregated salary measures to compare categories
- Dashboard layout combining headline KPIs with detailed breakdowns
Key Takeaways
- The dashboard contains 1,796 job postings with an overall average salary of $78,435.
- Saskatchewan has the highest provincial average shown at $86,221.
- Prince Edward Island has the lowest provincial average shown at $51,100.
- Senior roles average $81,490, compared with $71,559 for Junior roles.
- Business Systems Analysts have the highest average salary among the displayed job titles at $86,688.
- Average salaries by work arrangement are closely grouped, ranging from $77,727 to $78,447.
Conclusion
Building this dashboard reinforced how much context can be added to a simple salary figure by breaking it down across several dimensions. The overall average of $78,435 is useful on its own, but the provincial, seniority, job title, and work arrangement views reveal where the bigger differences actually appear. It also shows why choosing the right visuals matters. The combination of KPI cards, comparison charts, and categorical breakdowns makes it possible to move from a broad salary overview to specific observations without losing sight of the overall dataset.
- Version
- Download 10
- File Size 1.18 MB
- File Count 4
- Create Date September 22, 2026
- Last Updated September 22, 2026
