

[free_download_btn]
Marketing dashboards are usually built to answer one question dressed up as many: where should the next dollar go. For this project I worked with a Nykaa ad campaign dataset covering revenue, ROI, engagement, and lead generation across multiple channels and time periods, and built a Power BI dashboard around it that lets you slice the data by campaign type and customer segment.
Nykaa is one of India's largest beauty and lifestyle platforms, so a dataset like this mirrors the kind of decisions a real marketing team makes every quarter. I wanted the dashboard to move past vanity metrics and actually surface where spend was working and where it wasn't.
Key Performance Overview
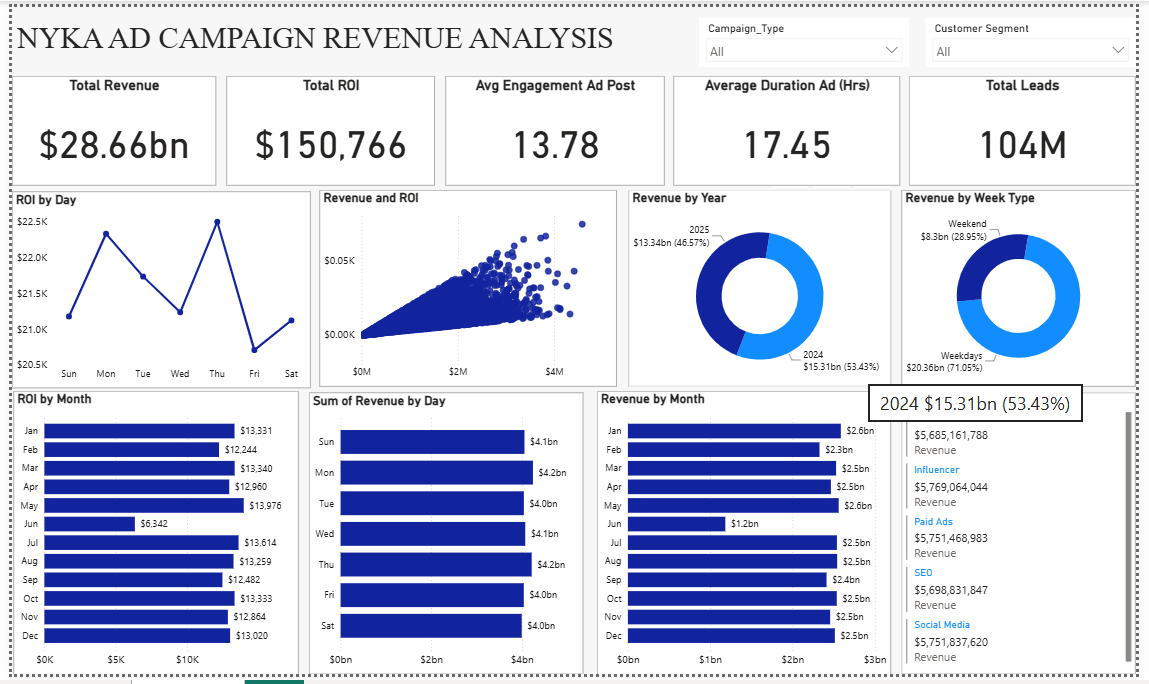
At the top level, the campaigns generated $28.66 billion in total revenue with an ROI of $150,766. Average engagement per ad post sat at 13.78, average ad duration came in at 17.45 hours, and the campaigns produced a combined 104 million leads. These five numbers set the frame for everything else in the dashboard, giving a sense of scale before drilling into where that performance actually came from.
ROI by Day of the Week
ROI doesn't move evenly across the week. It spikes on Monday and Thursday, dips through Tuesday and Wednesday, and drops to its lowest point on Friday before climbing again on Saturday. That kind of pattern matters for anyone planning ad spend, since it points to specific days worth prioritizing rather than treating the week as one flat block.
Revenue Against ROI
Plotting revenue against ROI produces a wide scatter rather than a clean upward line. Most campaigns cluster at lower spend levels with a broad range of returns, and a handful of high spend outliers don't necessarily outperform smaller campaigns on ROI. The takeaway is that bigger budgets don't guarantee proportionally better returns, and efficiency deserves as much attention as scale.
Revenue by Year
Comparing 2024 and 2025, 2024 accounted for 53.43 percent of revenue at $15.31 billion, while 2025 brought in $13.34 billion, or 46.57 percent. The gap is modest rather than dramatic, suggesting overall performance held steady rather than swinging sharply between years.
Weekday vs Weekend Revenue
Weekdays generated the clear majority of revenue at 71.05 percent, or $20.36 billion, compared to $8.3 billion on weekends. That's a stronger weekday lean than a lot of consumer marketing assumptions would predict, and it's a good example of why checking the data beats trusting instinct.
Revenue by Month
Monthly revenue stays fairly consistent, mostly ranging between $2.3 billion and $2.6 billion, with June standing out as a clear dip at $1.2 billion. Outside of that one outlier, the year shows a stable, predictable revenue rhythm rather than sharp seasonal swings.
Revenue by Campaign Type
Breaking revenue down by channel shows influencer marketing, paid ads, SEO, and social media all landing close together, each around $5.7 billion. That tight clustering says a lot on its own. Rather than one channel dominating and the rest trailing behind, this points to a genuinely diversified acquisition strategy where no single channel is carrying the business alone.
Methodology: Tools and Approach
This dashboard was built in Power BI using a mix of visuals chosen to match the shape of each question being asked.
Key techniques used include:
- KPI cards for headline metrics across revenue, ROI, engagement, duration, and leads
- A line chart for ROI trends by day of the week
- A scatter plot comparing revenue against ROI
- Donut charts for year over year and weekday versus weekend revenue splits
- Horizontal bar charts for ROI by month and revenue by day
- A column chart for revenue by month
- A breakdown panel for revenue by campaign type
- Interactive slicers for campaign type and customer segment
Key Takeaways
- ROI varies meaningfully by day of the week, with Monday and Thursday standing out as the strongest performers
- Higher spend doesn't reliably translate to higher ROI, making efficiency a bigger lever than budget size
- 2024 slightly outperformed 2025 in total revenue share
- Weekdays drive over 70 percent of total revenue, well ahead of weekends
- June is the one clear low point in an otherwise steady monthly revenue pattern
- Revenue is split almost evenly across influencer, paid ads, SEO, and social channels, pointing to a diversified strategy rather than reliance on one channel
Conclusion
This project reinforced something I keep coming back to with dashboard work. The value isn't in the number of charts on the page, it's in whether each one answers a real question a stakeholder would ask. Here, every visual points toward a decision: which day to push spend, which channel is pulling its weight, and whether bigger budgets are actually earning their keep. That's the bar I try to hit with every dashboard I build.
If you want to dig into the same data yourself, you can find it on Kaggle here: https://www.kaggle.com/datasets/ishitabahamnia/nykaa-campaign-data-csv. A dataset built around $28 billion in ad spend usually has more than one story worth pulling out of it.
- Version
- Download 23
- File Size 7.34 MB
- File Count 3
- Create Date September 21, 2026
- Last Updated September 21, 2026
