

[free_download_btn]
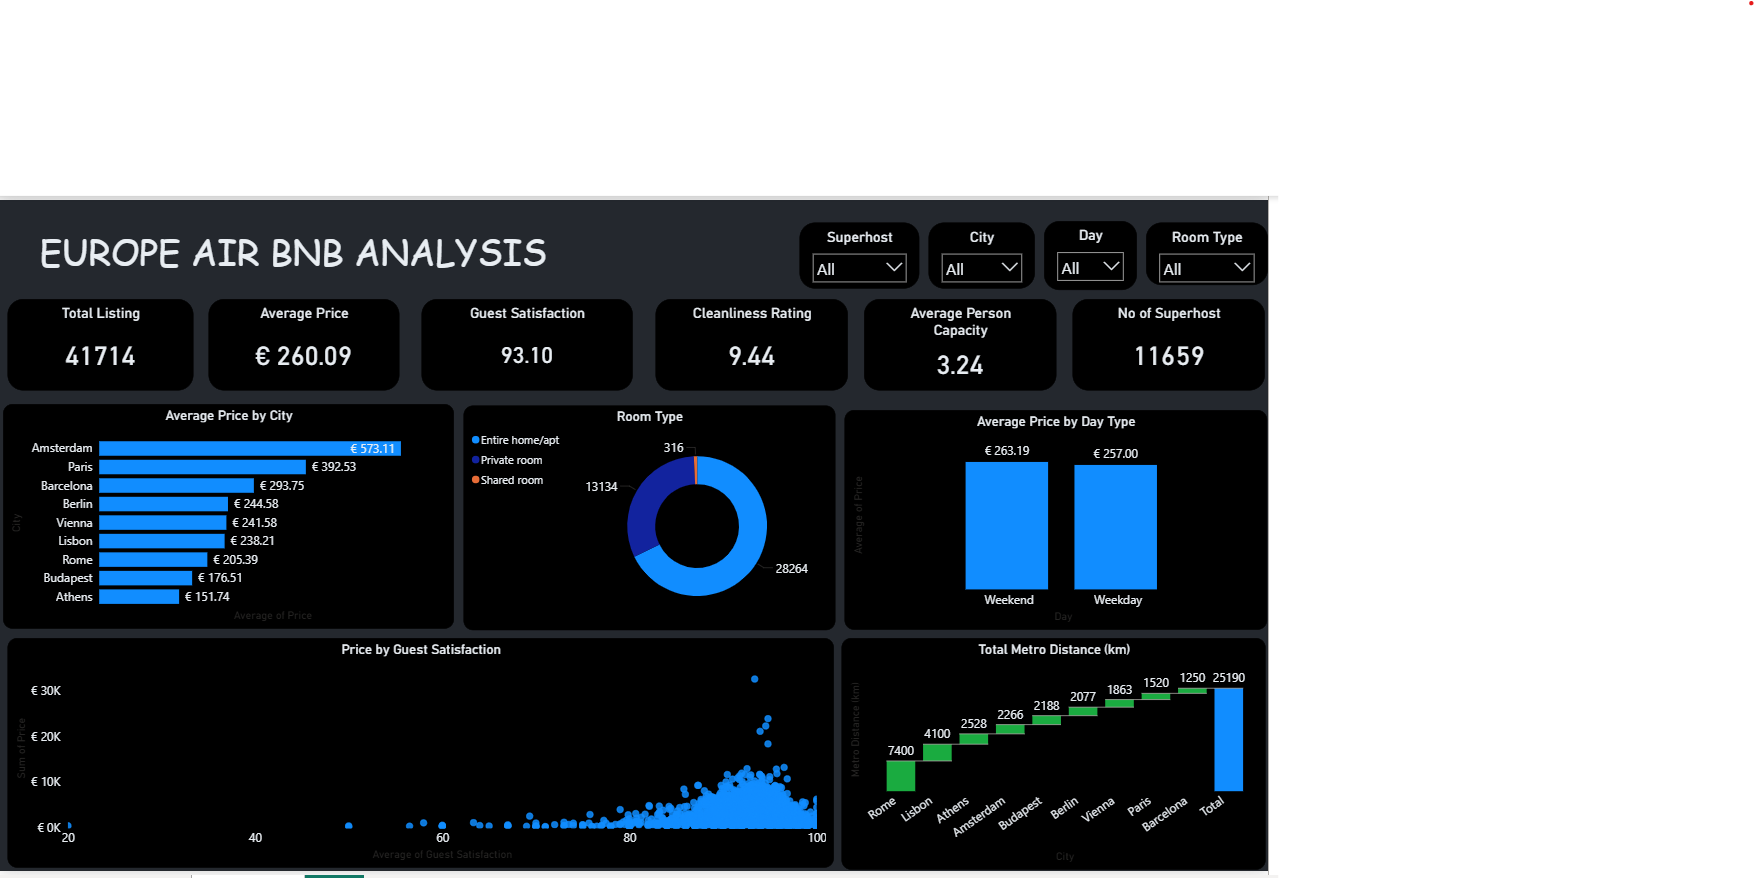 Short-term rentals have become one of the clearest windows into how a city's tourism economy actually works, and Europe offers one of the richest playgrounds for this kind of analysis. In this project, I explored a dataset of 41,714 Airbnb listings spanning nine major European cities, using Power BI to uncover pricing patterns, room type preferences, guest satisfaction trends, and proximity to public transport.
The dataset, sourced from Kaggle, was visualized using a custom-built Europe Airbnb Analysis dashboard. Interactive slicers for superhost status, city, day type, and room type were added to let users filter the data and drill into specific segments on demand.
Key Performance Overview
At a glance, the dashboard paints a picture of a diverse and heavily supplied market. Across the nine cities, there are 41,714 total listings with an average price of €260.09 per night. Guests rate their experiences highly, with an average guest satisfaction score of 93.10 and an average cleanliness rating of 9.44. The typical listing accommodates 3.24 guests, and out of the full listing pool, 11,659 hosts hold superhost status, a strong sign of an experienced and quality-conscious host base across the region.
Average Price by City
Amsterdam stands well apart from the rest of the pack as the most expensive city to book, averaging €573.11 per night, more than €180 ahead of the next closest city. Paris follows at €392.53, then Barcelona at €293.75.
The remaining cities cluster much closer together: Berlin (€244.58), Vienna (€241.58), and Lisbon (€238.21) sit within a tight €6 band, while Rome (€205.39), Budapest (€176.51), and Athens (€151.74) round out the more affordable end of the market.
This spread suggests two distinct pricing tiers rather than a gradual slope: a premium tier led by Amsterdam and Paris, and a value tier where Southern and Eastern European cities compete on price. Athens, at under a third of Amsterdam's average rate, stands out as the most budget-friendly option in the dataset.
Room Type Preferences
The room type breakdown shows a clear guest preference for privacy and space. Entire home/apartment listings dominate with 28,264 bookings, well over double the next category. Private rooms account for 13,134 listings, while shared rooms are a minor share at just 316.
This distribution reflects a broader shift in the short-term rental market, where guests increasingly favor the independence of a full unit over shared or budget accommodation. For hosts, it signals that listing an entire home is still the strongest play for demand, though private rooms retain a meaningful niche, likely among budget travelers and solo guests.
Weekend vs Weekday Pricing
Pricing by day type reveals a relatively modest gap between weekend and weekday rates. Weekend nights average €263.19, just €6.19 higher than the weekday average of €257.00.
The narrowness of this gap is notable. It suggests that demand for Airbnb listings across these cities is not purely leisure-driven around weekend getaways; a meaningful share of bookings likely comes from business travel, extended stays, or city breaks that span both weekdays and weekends. Hosts looking to optimize revenue may find limited upside in aggressive weekend-only pricing strategies.
Price and Guest Satisfaction
The scatter plot comparing average guest satisfaction against price reveals that the vast majority of listings cluster in the 80 to 100 satisfaction range, regardless of price point. This indicates that guest satisfaction across the platform is generally high and not strongly tied to how much a listing costs.
A small number of high-priced outliers, some exceeding €25,000 in summed price, sit at the very top end of the satisfaction scale as well, suggesting that premium listings are, if anything, slightly more likely to deliver a top-tier guest experience rather than underdeliver on price.
Proximity to Metro Access
The metro distance breakdown highlights meaningful differences in transport accessibility across cities. Rome has the largest total distance to metro stations among its listings at 7,400 km, followed by Lisbon at 4,100 km and Athens at 2,528 km.
Amsterdam (2,266 km), Budapest (2,188 km), Berlin (2,077 km), and Vienna (1,863 km) sit in the middle of the pack, while Paris (1,520 km) and Barcelona (1,250 km) have the shortest total distances, indicating their listings tend to cluster closer to metro infrastructure.
This pattern may partly explain some of the pricing trends seen earlier. Cities like Paris and Barcelona, where listings sit closer to transit, also rank among the pricier markets, while Rome and Athens, with greater average distances from metro access, fall on the more affordable end.
Methodology: Tools and Approach
This analysis was built in Power BI, using a combination of visuals to surface patterns across pricing, room type, satisfaction, and location.
Key techniques used include:
- KPI cards for high-level performance metrics across listings, price, satisfaction, and superhost count
- A horizontal bar chart for average price by city comparison
- A donut chart for room type distribution
- A column chart comparing weekend and weekday pricing
- A scatter plot mapping price against guest satisfaction
- A waterfall-style chart breaking down total metro distance by city
- Interactive slicers for superhost status, city, day type, and room type
Key Takeaways
- Amsterdam and Paris command a clear price premium over the rest of the dataset
- Entire home/apartment listings dominate demand, more than doubling private and shared rooms combined
- Weekend and weekday pricing are nearly identical, pointing to steady demand across the week rather than weekend-only spikes
- Guest satisfaction stays high across nearly all price points, with premium listings trending even higher
- Paris and Barcelona listings sit closest to metro access, while Rome and Athens listings are furthest on average
- Superhosts make up over a quarter of all listings, reflecting a mature, experience-driven host base
Conclusion
This analysis reinforces how much a well-structured dashboard can reveal about a market as large and varied as European short-term rentals. Beyond simply knowing the average price or listing count, breaking the data down by city, room type, day, and transport access uncovers the underlying structure of how guests choose where to stay and what they're willing to pay for it.
For hosts, analysts, and travelers alike, this highlights the value of combining publicly available data with the right visualization approach to surface insights that go well beyond the surface-level numbers.
Data source: Airbnb Cleaned Europe Dataset on Kaggle
- Version
- Download 83
- File Size 4.21 MB
- File Count 2
- Create Date September 1, 2026
- Last Updated September 1, 2026