
[free_download_btn]
 Over the past year, this coffee shop's sales data tells a rich story of customer habits, product preferences, and peak performance windows. In this analysis, I explored data from March 2024 to March 2025 across eight product categories, multiple time-of-day windows, and every day of the week using Microsoft Excel to uncover patterns that explain revenue performance and customer behavior.
The dataset from Kaggle was visualized using a custom-built Coffee Sales Dashboard. To enhance the insights, advanced data modelling and dynamic KPI displays were used, creating a more interactive and visually engaging analysis.
Key Performance Overview
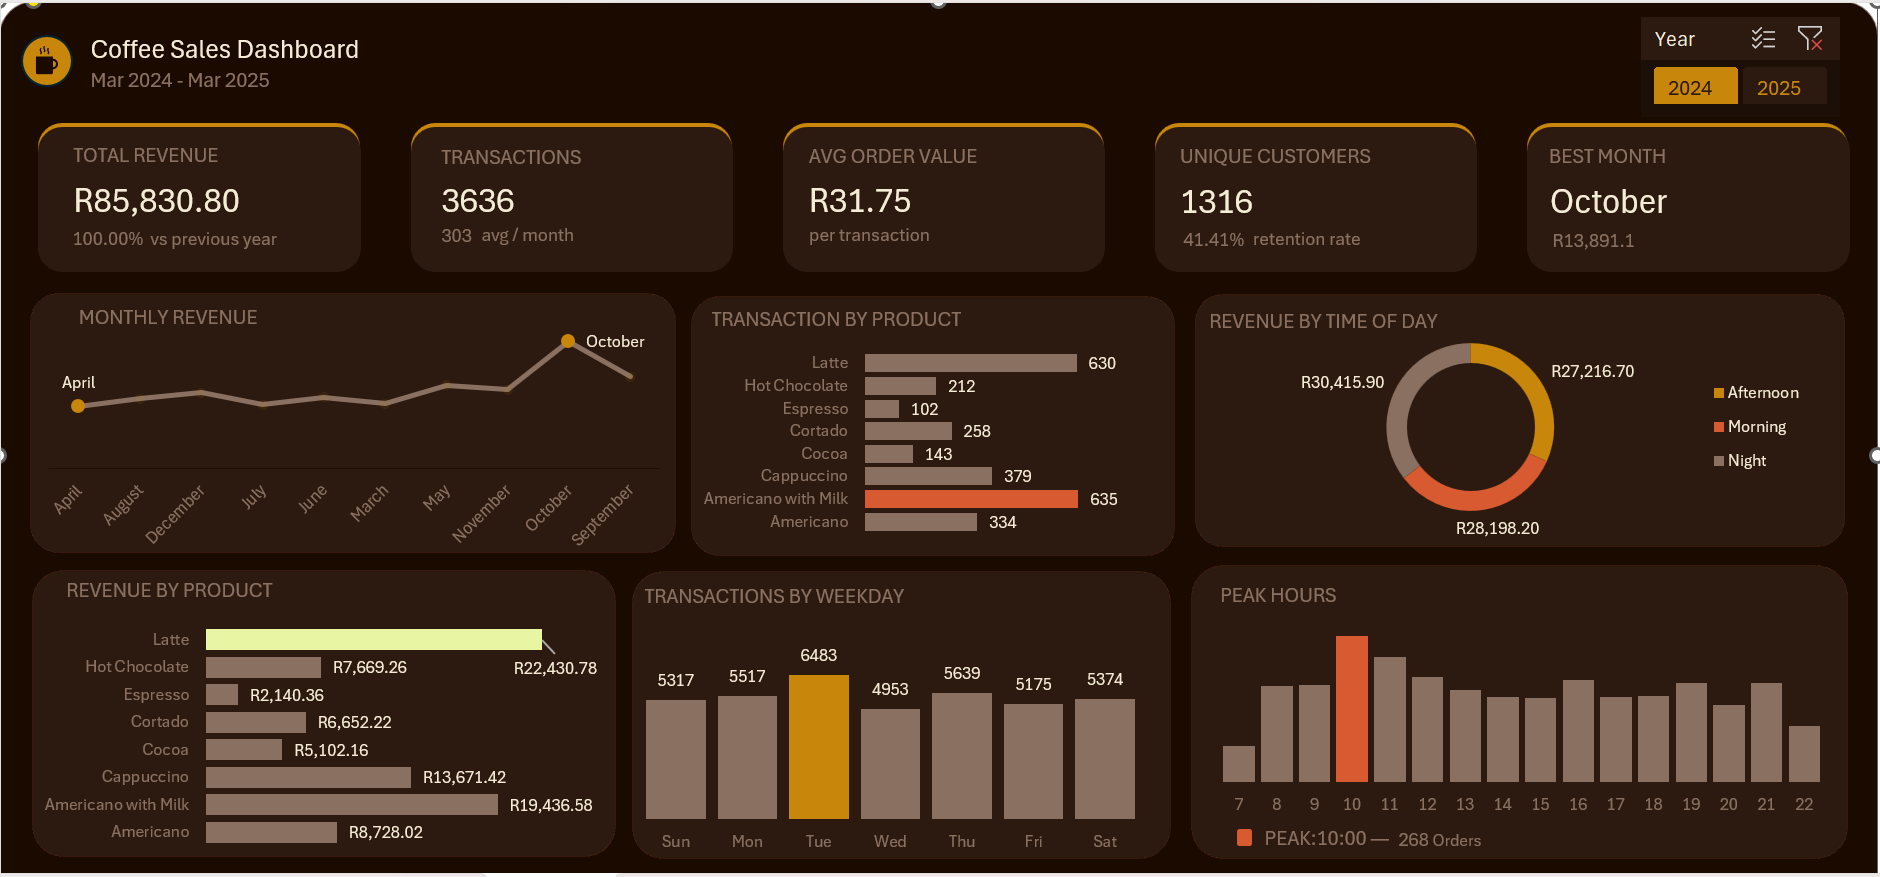
At a glance, the dashboard tells a strong story. The shop generated a total revenue of R85,830.80 across 3,636 transactions, averaging R31.75 per order. With 1,316 unique customers and a 41.41% retention rate, the business demonstrates a solid loyal customer base alongside consistent new traffic.
The best month of the year was October, which recorded R13,891.10 in revenue — a notable spike that warrants closer examination.
Monthly Revenue Trends
The monthly revenue chart reveals a relatively flat performance curve through the early months of the year, with a clear peak in October and a noticeable low point in April.
The mid-year period from June through September shows gradual recovery before the October surge. This pattern suggests that external factors — seasonal demand, promotional activity, or local events likely drove the October performance spike. The post-October decline into early 2025 mirrors a common seasonal cooldown.
Understanding what drove October's success could be a blueprint for replicating that performance in typically quieter months.
Product Performance
Americano with Milk
Americano with Milk emerges as the top-selling product by transaction volume, recording 635 orders — the highest of any item on the menu. Its revenue contribution of R19,436.58 further cements its position as the shop's flagship product.
This product's popularity suggests customers favour a balanced, milky espresso drink over more intense or niche alternatives. Ensuring consistent quality and availability of this product is critical to maintaining overall sales performance.
Latte
Latte is the second most ordered item with 630 transactions and the highest revenue generator at R22,430.78 meaning it commands a slightly higher average price per unit than Americano with Milk.
Together, Latte and Americano with Milk account for the majority of both transaction volume and revenue, making them the twin pillars of the product lineup.
Cappuccino
Cappuccino ranks third in transactions with 379 orders and contributes R13,671.42 in revenue. It performs solidly but trails the top two by a meaningful margin, suggesting it appeals to a distinct customer segment rather than the general base.
Cortado and Hot Chocolate
Cortado and Hot Chocolate occupy the mid-tier with 258 and 212 transactions respectively. Cortado's revenue of R6,652.22 and Hot Chocolate's R7,669.26 suggest that Hot Chocolate carries a premium price point relative to its volume.
Hot Chocolate's performance is particularly worth watching in colder months, where seasonal demand may drive stronger sales.
Americano, Cocoa, and Espresso
The lower-volume products — Americano (334 orders, R8,728.02), Cocoa (143 orders, R5,102.16), and Espresso (102 orders, R2,140.36) represent niche offerings. Espresso's low transaction count but reasonable revenue per unit makes it a speciality item rather than a volume driver.
Revenue by Time of Day
One of the most revealing findings in the dashboard is the near-even split of revenue across the three day parts:
- Afternoon: R27,216.70
- Night: R28,198.20
- Morning: R30,415.90
Morning leads, as expected for a coffee business but the margin is surprisingly narrow. The strong afternoon and night performance suggests that the shop is not purely a morning-commuter destination; it serves customers throughout the full day.
This is a significant operational insight. Staffing, stock levels, and marketing should reflect this all-day demand rather than concentrating resources on the morning window alone.
Transactions by Weekday
The weekday breakdown reveals that Tuesday is the busiest day, recording 6,483 transactions significantly above the weekly average.
Wednesday is the quietest day with 4,953 transactions, while the weekend days (Saturday: 5,374 and Sunday: 5,317) perform modestly. This is somewhat counterintuitive — weekdays, particularly Tuesday and Thursday (5,639), outperform the weekend.
This pattern may indicate that the shop's primary customer base consists of office workers or students rather than leisure shoppers. Targeted promotions on quieter days like Wednesday and Sunday could help level out demand across the week.
Peak Hours
The peak hours chart identifies 10:00 AM as the single busiest hour, recording 268 orders. The distribution shows strong activity from 9:00 AM through to 11:00 AM, with a gradual but sustained tail into the afternoon and evening hours.
The relatively active evening hours align with the strong night revenue segment noted earlier, reinforcing that this is a multi-shift business with genuine demand beyond the traditional morning coffee window.
Methodology: Tools and Approach
This analysis was conducted using Microsoft Excel, showcasing how powerful structured data visualisation can be when applied to operational retail data.
Key techniques used include:
- KPI cards for high-level performance metrics
- Time series line charts for monthly trend analysis
- Horizontal bar charts for product volume and revenue comparison
- A donut chart for time-of-day revenue segmentation
- A bar chart for weekday transaction distribution
- An hourly histogram for peak hours identification
This approach demonstrates that even a single year of transactional data, when visualised effectively, can surface actionable insights that go beyond surface-level observations.
Key Takeaways
- Americano with Milk and Latte dominate both in volume and revenue
- October is the standout month and warrants investigation into replicable drivers
- Revenue is remarkably balanced across Morning, Afternoon, and Night — this is an all-day business
- Tuesday is the peak trading day; Wednesday and Sunday represent growth opportunities
- 10:00 AM is the single busiest hour, but evening hours sustain meaningful demand
- Espresso and Cocoa underperform in volume and may benefit from promotional focus
Conclusion
This analysis reinforces an important principle: success whether in a coffee shop or any other business is driven by understanding your customers, your products, and the rhythms of demand over time.
Using a well-structured sales dashboard and publicly available transactional data, it is possible to uncover powerful insights that go far beyond simply knowing total revenue. For analysts and business owners alike, this highlights the importance of combining the right visualisation tools with the right analytical approach to generate meaningful, actionable intelligence.
- Version
- Download 56
- File Size 783.14 KB
- File Count 1
- Create Date April 24, 2026
- Last Updated April 24, 2026
| File | Action |
|---|---|
| Coffe_sales.xlsx | Download |